VMware ESXi 6.0.0 guest Linux Vs. Native Linux in speeds
VMware released a new version of their widly used industry standard hypervisor; the VMware ESXi 6.0.0. On their release, VMware promises increased speeds on all areas, and even lower footprint on guest OS’s. I decided to put the promises to the test.
I have IBM System x3400 E5410 server hardware laying around with IBM ServeRAID 8k hardware RAID controller. I configured four IBM SAS hard disks as RAID-10 and installed VMware ESXi 6.0.0. I enabled the SSH and installed ProFTPd. No other configurations were made.
Next I installed the guest OS; Ubuntu Linux Server 14.04.2 LTS X64. I used 4 x processor cores, 4GB of RAM, and 100GB of hard disk. In Ubuntu, I used LVM. After installation I installed SSH and updated the OS via aptitude update && aptitude dist-upgrade. Now I was ready to run the tests.
There are different ways to benchmark your system, but I decided to use HDparm, dd, and external tool sysbench.
At first, I didn’t have VMware tools nor OpenVM-tools installed:
- hdparm -Tt /dev/sda
- /dev/sda:
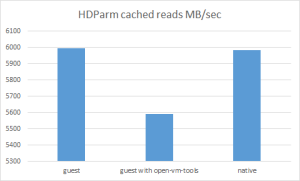
Timing cached reads: 11978 MB in 2.00 seconds = 5995.24 MB/sec
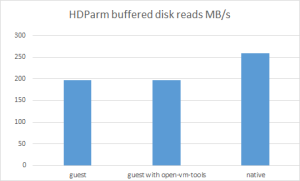
Timing buffered disk reads: 596 MB in 3.02 seconds = 197.04 MB/sec
- /dev/sda:
- dd if=/dev/zero of=/tmp/10G.file bs=1MB count=10000
- 10000+0 records in
10000+0 records out
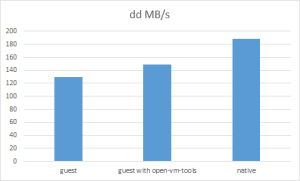
10000000000 bytes (10 GB) copied, 76.6417 s, 130 MB/s
- 10000+0 records in
- sysbench –test=cpu –cpu-max-prime=20000 run
- sysbench 0.4.12: multi-threaded system evaluation benchmarkRunning the test with following options:
Number of threads: 1Doing CPU performance benchmarkThreads started!
Done.Maximum prime number checked in CPU test: 20000Test execution summary:
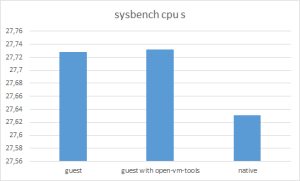
total time: 27.7280s
total number of events: 10000
total time taken by event execution: 27.7161
per-request statistics:
min: 2.76ms
avg: 2.77ms
max: 3.17ms
approx. 95 percentile: 2.78msThreads fairness:
events (avg/stddev): 10000.0000/0.00
execution time (avg/stddev): 27.7161/0.00
- sysbench 0.4.12: multi-threaded system evaluation benchmarkRunning the test with following options:
- sysbench –test=fileio –file-total-size=50G prepare
- sysbench –test=fileio –file-total-size=50G –file-test-mode=rndrw –init-rng=on –max-time=300 –max-requests=0 run
- sysbench 0.4.12: multi-threaded system evaluation benchmarkRunning the test with following options:
Number of threads: 1
Initializing random number generator from timer.Extra file open flags: 0
128 files, 400Mb each
50Gb total file size
Block size 16Kb
Number of random requests for random IO: 0
Read/Write ratio for combined random IO test: 1.50
Periodic FSYNC enabled, calling fsync() each 100 requests.
Calling fsync() at the end of test, Enabled.
Using synchronous I/O mode
Doing random r/w test
Threads started!
Time limit exceeded, exiting…
Done.Operations performed: 57738 Read, 38492 Write, 123136 Other = 219366 Total
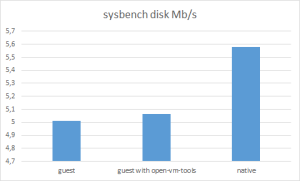
Read 902.16Mb Written 601.44Mb Total transferred 1.4684Gb (5.0118Mb/sec)
320.76 Requests/sec executedTest execution summary:
total time: 300.0103s
total number of events: 96230
total time taken by event execution: 278.0289
per-request statistics:
min: 0.01ms
avg: 2.89ms
max: 205.97ms
approx. 95 percentile: 6.43msThreads fairness:
events (avg/stddev): 96230.0000/0.00
execution time (avg/stddev): 278.0289/0.00
- sysbench 0.4.12: multi-threaded system evaluation benchmarkRunning the test with following options:
Next, the same tests with open-vm-tools installed in guest:
- hdparm -Tt /dev/sda
- /dev/sda:
Timing cached reads: 11172 MB in 2.00 seconds = 5591.90 MB/sec
Timing buffered disk reads: 598 MB in 3.03 seconds = 197.31 MB/sec
- /dev/sda:
- dd if=/dev/zero of=/tmp/10G.file bs=1MB count=10000
- 10000+0 records in
10000+0 records out
10000000000 bytes (10 GB) copied, 67.1728 s, 149 MB/s
- 10000+0 records in
- sysbench –test=cpu –cpu-max-prime=20000 run
- sysbench 0.4.12: multi-threaded system evaluation benchmarkRunning the test with following options:
Number of threads: 1Doing CPU performance benchmarkThreads started!
Done.Maximum prime number checked in CPU test: 20000Test execution summary:
total time: 27.7324s
total number of events: 10000
total time taken by event execution: 27.7207
per-request statistics:
min: 2.76ms
avg: 2.77ms
max: 3.15ms
approx. 95 percentile: 2.78msThreads fairness:
events (avg/stddev): 10000.0000/0.00
execution time (avg/stddev): 27.7207/0.00
- sysbench 0.4.12: multi-threaded system evaluation benchmarkRunning the test with following options:
- sysbench –test=fileio –file-total-size=50G prepare
- sysbench –test=fileio –file-total-size=50G –file-test-mode=rndrw –init-rng=on –max-time=300 –max-requests=0 run
- sysbench 0.4.12: multi-threaded system evaluation benchmarkRunning the test with following options:
Number of threads: 1
Initializing random number generator from timer.Extra file open flags: 0
128 files, 400Mb each
50Gb total file size
Block size 16Kb
Number of random requests for random IO: 0
Read/Write ratio for combined random IO test: 1.50
Periodic FSYNC enabled, calling fsync() each 100 requests.
Calling fsync() at the end of test, Enabled.
Using synchronous I/O mode
Doing random r/w test
Threads started!
Time limit exceeded, exiting…
Done.Operations performed: 58323 Read, 38882 Write, 124416 Other = 221621 Total
Read 911.3Mb Written 607.53Mb Total transferred 1.4832Gb (5.0618Mb/sec)
323.96 Requests/sec executedTest execution summary:
total time: 300.0551s
total number of events: 97205
total time taken by event execution: 277.2583
per-request statistics:
min: 0.01ms
avg: 2.85ms
max: 174.75ms
approx. 95 percentile: 6.39msThreads fairness:
events (avg/stddev): 97205.0000/0.00
execution time (avg/stddev): 277.2583/0.00
- sysbench 0.4.12: multi-threaded system evaluation benchmarkRunning the test with following options:
No significant differences there… Only thing that caught my eye was the difference of dd: 130 MB/s Vs. 149 MB/s, which makes 14,6%. This can be in variation of testing method; dd should be used without the caching. But next is the fun and really interesting part: the same tests with native Ubuntu. Installation was made with same configuration as above. The tests show:
- hdparm -Tt /dev/sda
- /dev/sda:
Timing cached reads: 11958 MB in 2.00 seconds = 5985.54 MB/sec
Timing buffered disk reads: 778 MB in 3.00 seconds = 258.92 MB/sec
- /dev/sda:
- dd if=/dev/zero of=/tmp/10G.file bs=1MB count=10000
- 10000+0 records in
10000+0 records out
10000000000 bytes (10 GB) copied, 53.1518 s, 188 MB/s
- 10000+0 records in
- sysbench –test=cpu –cpu-max-prime=20000 run
- sysbench 0.4.12: multi-threaded system evaluation benchmarkRunning the test with following options:
Number of threads: 1Doing CPU performance benchmarkThreads started!
Done.Maximum prime number checked in CPU test: 20000
Test execution summary:
total time: 27.6305s
total number of events: 10000
total time taken by event execution: 27.6170
per-request statistics:
min: 2.75ms
avg: 2.76ms
max: 3.25ms
approx. 95 percentile: 2.76msThreads fairness:
events (avg/stddev): 10000.0000/0.00
execution time (avg/stddev): 27.6170/0.00
- sysbench 0.4.12: multi-threaded system evaluation benchmarkRunning the test with following options:
- sysbench –test=fileio –file-total-size=50G prepare
- sysbench –test=fileio –file-total-size=50G –file-test-mode=rndrw –init-rng=on –max-time=300 –max-requests=0 run
- sysbench 0.4.12: multi-threaded system evaluation benchmarkRunning the test with following options:
Number of threads: 1
Initializing random number generator from timer.Extra file open flags: 0
128 files, 400Mb each
50Gb total file size
Block size 16Kb
Number of random requests for random IO: 0
Read/Write ratio for combined random IO test: 1.50
Periodic FSYNC enabled, calling fsync() each 100 requests.
Calling fsync() at the end of test, Enabled.
Using synchronous I/O mode
Doing random r/w test
Threads started!
Time limit exceeded, exiting…
Done.Operations performed: 64264 Read, 42842 Write, 137088 Other = 244194 Total
Read 1004.1Mb Written 669.41Mb Total transferred 1.6343Gb (5.5782Mb/sec)
357.00 Requests/sec executedTest execution summary:
total time: 300.0138s
total number of events: 107106
total time taken by event execution: 277.4529
per-request statistics:
min: 0.01ms
avg: 2.59ms
max: 170.14ms
approx. 95 percentile: 6.21msThreads fairness:
events (avg/stddev): 107106.0000/0.00
execution time (avg/stddev): 277.4529/0.00
- sysbench 0.4.12: multi-threaded system evaluation benchmarkRunning the test with following options:
Here are the results as graphs:
Conclusion:
As expected, native installation of OS is faster in all areas. When using a hypervisor, it’s on the safe-side NOT to use any tools or 3rd party drivers / agents. The speed gain isn’t there and 3rd party tools / drivers / agents can cause problems.


Recent Comments